An examination of census data reveals certain patterns and trends across Cleveland’s neighborhoods that are deeply disturbing and cry out for attention. To view geographic crime data pertinent to each of the issues discussed below, click on the topic heading.
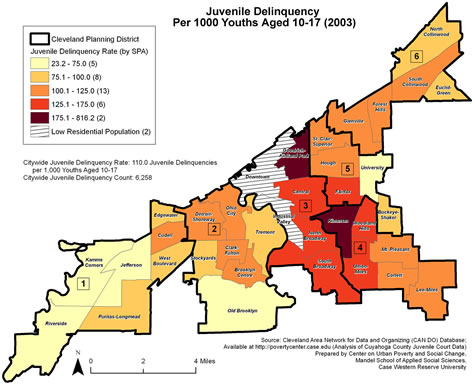
- Juvenile Delinquency : On this map, the darkest shaded areas indicate the highest concentrations of youths designated as “juvenile delinquents”. It should come as no surprise that these are also the city’s poorest neighborhoods. (click to enlarge map)
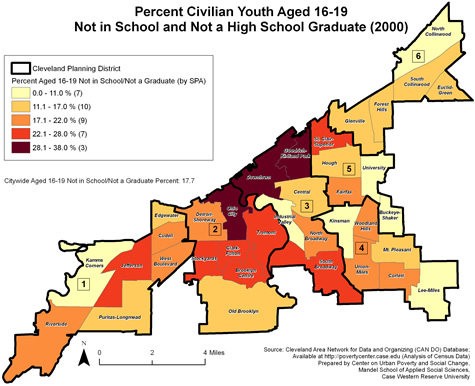
- Young Adults Neither Employed nor Attending School : On this map, the darker areas represent neighborhoods where census takers found large concentrations of 16-to-19-year-olds not enrolled in school and not in the workforce. (The reader will note that these areas—again, no surprise—correlate highly with those reporting the highest level of juvenile crime.) Roughly 4,300 youths citywide fall into this category, with more joining their ranks each year. This statistic is a crucial one, since what it measures is our ability to (a) educate our youth and (b) provide them with other opportunities beyond, or outside of, highschool. Neighborhood level initiatives outlined in the Connecting Cleveland plan could begin to stem this negative trend. (click to enlarge map)
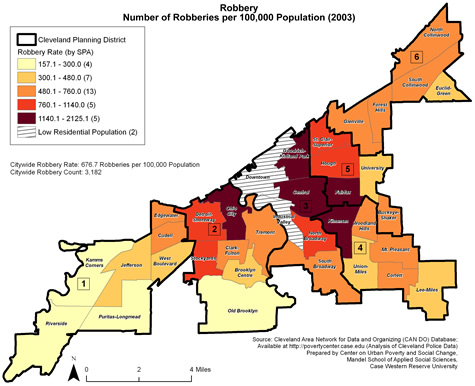
- Robbery: The next map tracks the distribution of robberies in Cleveland. Many of the areas where robberies occur most frequently are, once again, the same areas in which high concentrations of other criminal activities are found—presenting police, City government and residents with a very clear picture of where targeted efforts need to be initiated.(click to enlarge map)
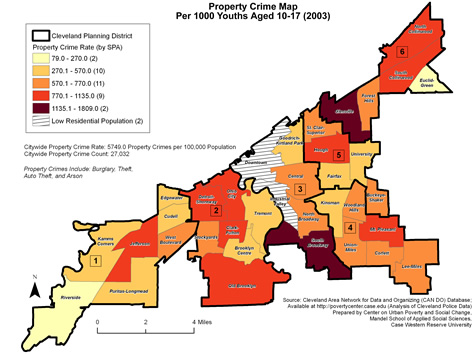
- Property Crimes: Certain other types of crime, on the other hand, do not seem to follow the same pattern. Crimes involving property, for example, occur more frequently in areas where the social conditions are not considered particularly dismal for example property crimes occur in neighborhoods where residents are better off, which makes sense when you think about it.
(click to enlarge map)
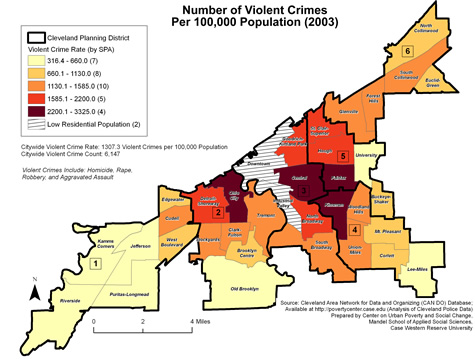
- Violent Crime: One of the most stunning patterns revealed by this map is the disturbing correlation between violent criminal activities and certain social indicators: Where a high incidence of violent crime is found, one also finds concentrations of lower-income residents, low educational attainment, high dropout and truancy rates, a low level of employment, indeed, a lack either of employment opportunities or of access to training in marketable skills—access, in other words, to hope. It should not take a rocket scientist to make the connection. The path to addressing the problem of juvenile delinquency becomes clear: concentrated, highly strategic implementation of the recommendations outlined in the Connecting Cleveland 2020 plan.
(click to enlarge map)
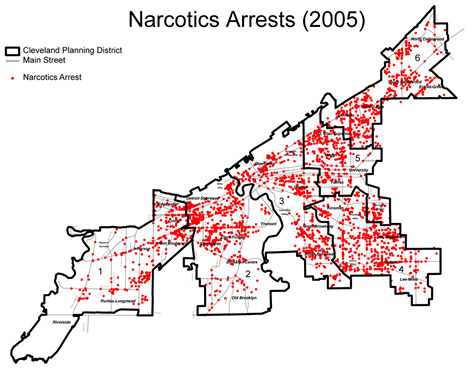
- Narcotics: One of the City’s primary goals in the area of development has direct implications for safety and the perception of safety: The creation of viable neighborhood retail districts promotes increased pedestrian, residential, retail and commercial activity, making these areas less desolate and thus seen as less dangerous. As this map shows, however, the majority of narcotics arrests tend to occur within and along the city’s major corridors. Considering the investment being made citywide in these areas, it may be necessary to implement deliberate anticrime measures—such as promoting the user of design principles that maximize sight lines and eliminate opportunities for mischief, as well as deploying bike-, mounted- and foot-patrol units strategically in these areas—to insure both the perception and reality of personal safety and secure property. (click to enlarge map)
Next Page:Safety:Challenges Back to Top
|