CENSUS 2020
Making CLE Count!
Census 2020 in Cleveland
First impressions of last year's Decennial Census results
Background
At any given time, the U.S. Census Bureau is conducting a variety of surveys and population estimates for the entire nation down to neighborhoods. These survey-based estimates—such as the American Community Survey (ACS)—can provide useful, frequent insights into demographic and social trends in between census years. However, the less frequent Decennial Censuses are the only accurate and precise total count of population reported down to every single block. It is the foundation of our representational government, as Census results inform per-capita political apportionment, redistricting, federal funding, business decisions, public health, transportation, and countless more.
For the Decennial Census, the Census Bureau only collects the most basic information about people by age, race, and sex. It also gathers information on household type and ownership. Starting with the 2010 Census, the U.S. Census Bureau stopped collecting more detailed information for the Decennial Census (previously called the long form). All the long form topics—like occupation, income, nationality, commute time, education, etc.—are collected through the American Community Survey on a rolling basis by random samples.
Timeline
- On March 12th, 2020, all Clevelanders were able to submit their own Census questionnaire online or by phone. Invitations to participate were sent by mail to every household in Cleveland. This was the first time online response was offered.
- On April 8th, 2020, the Census Bureau began sending paper questionnaires to households that had not responded yet after several reminders
- On May 13th, 2020 census takers visited every household that had not already responded.
- The scheduled end of all data collection was July 31st. Due to COVID-19 postponements, the deadline for data collection was extended to October 15th.
City-Wide Results
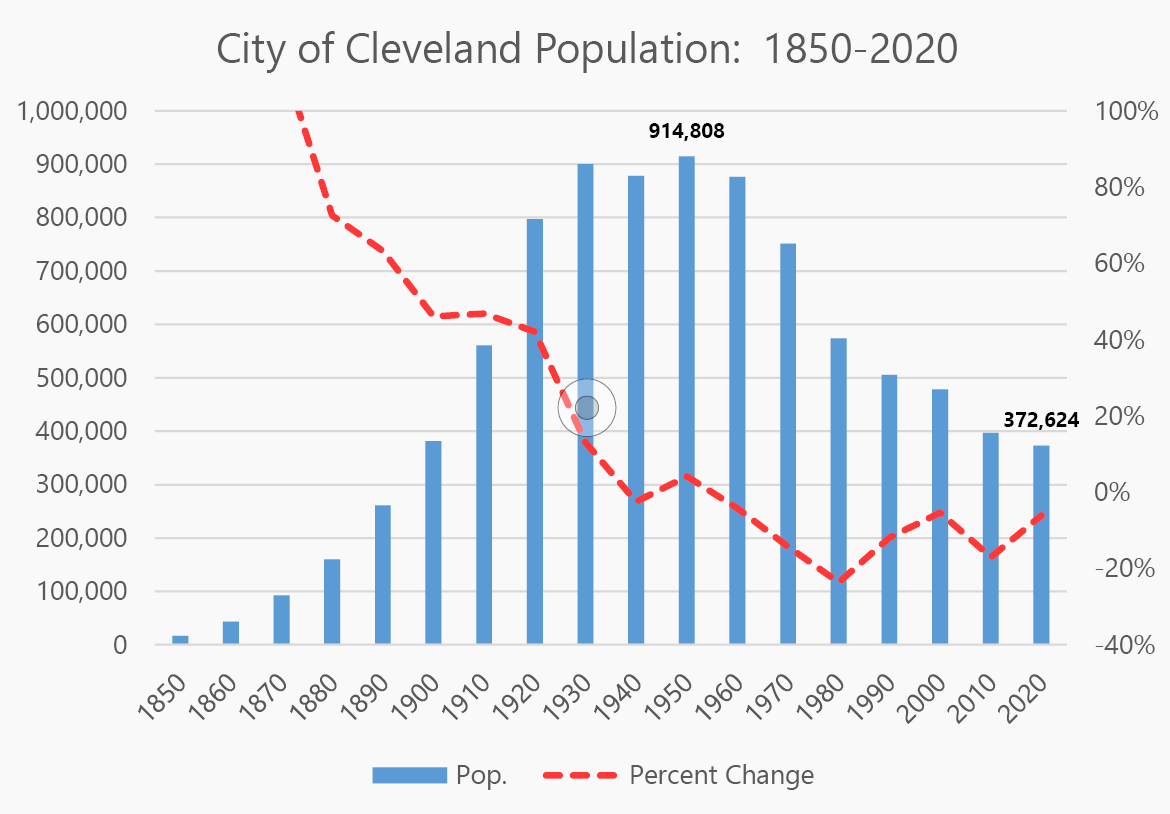
- 372,624 residents in the City of Cleveland in 2020.
- From 2010 to 2020, the City of Cleveland population decreased by -24,191, or -6%.
- The rate of population loss slowed from -17% (2000 to 2010) to -6% (2010 to 2020).
- Cleveland, OH was the 54th largest city by population in 2020. Previously, it was 45th.
The U.S. Census Bureau counted 372,624 residents in the City of Cleveland in 2020.
Race & Ethnicity
Cleveland's Black alone population saw the largest decrease (-31,448), followed by white alone (-19,486). As of 2020, the City is no longer greater than 50% African-American alone, and the white alone percentage is nearing 30% after decades of percent decrease. (download Cleveland race by year data)
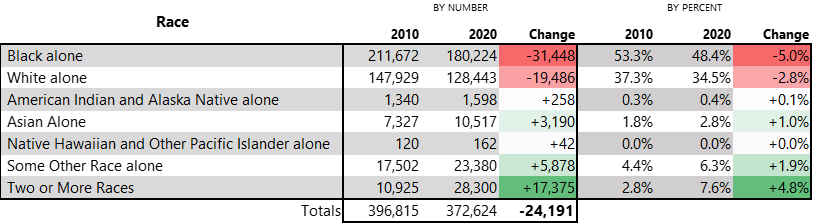
The largest increases by race were seen in Cleveland's multiracial and Asian population. Notably, the Two or More Race group grew by 17,375 people. Almost 40% of that gain in the Two or More Race group (10,598) identified as Hispanic or Latino as well, suggesting an overlap between the growing multiracial and Latino communities.

More than 1 out of 8 Clevelanders are Hispanic or Latino in 2020.
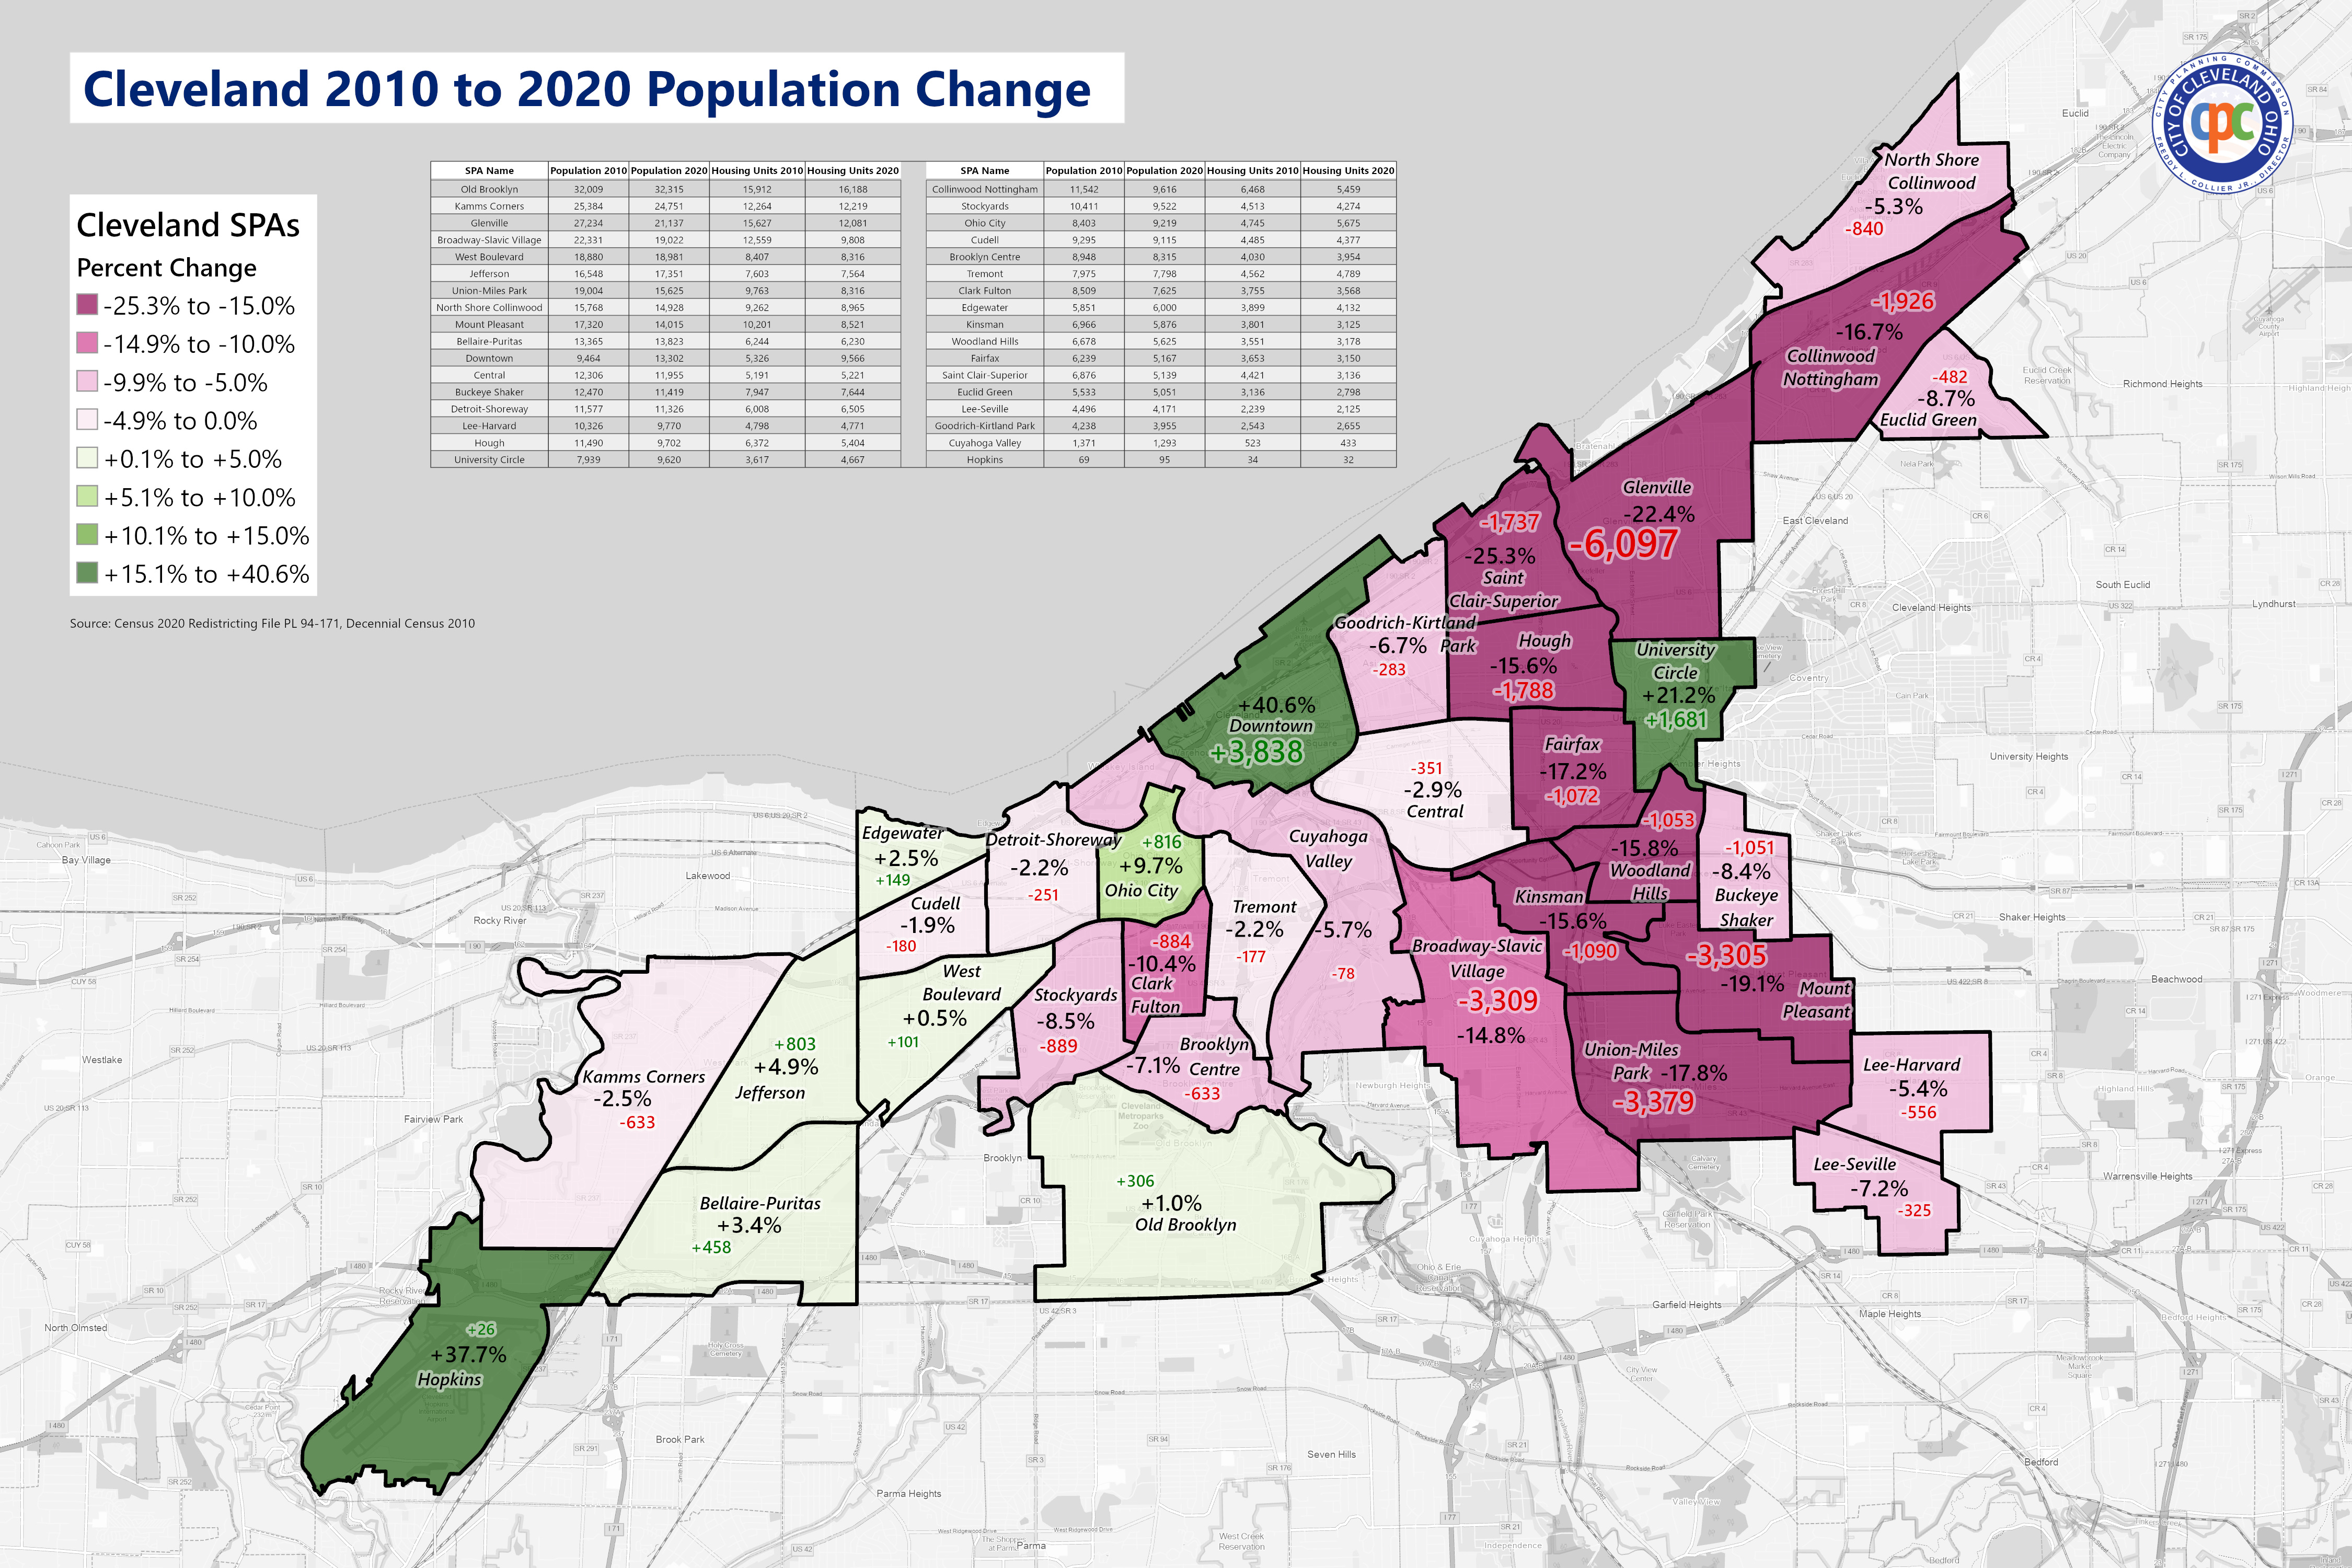
Neighborhood Level
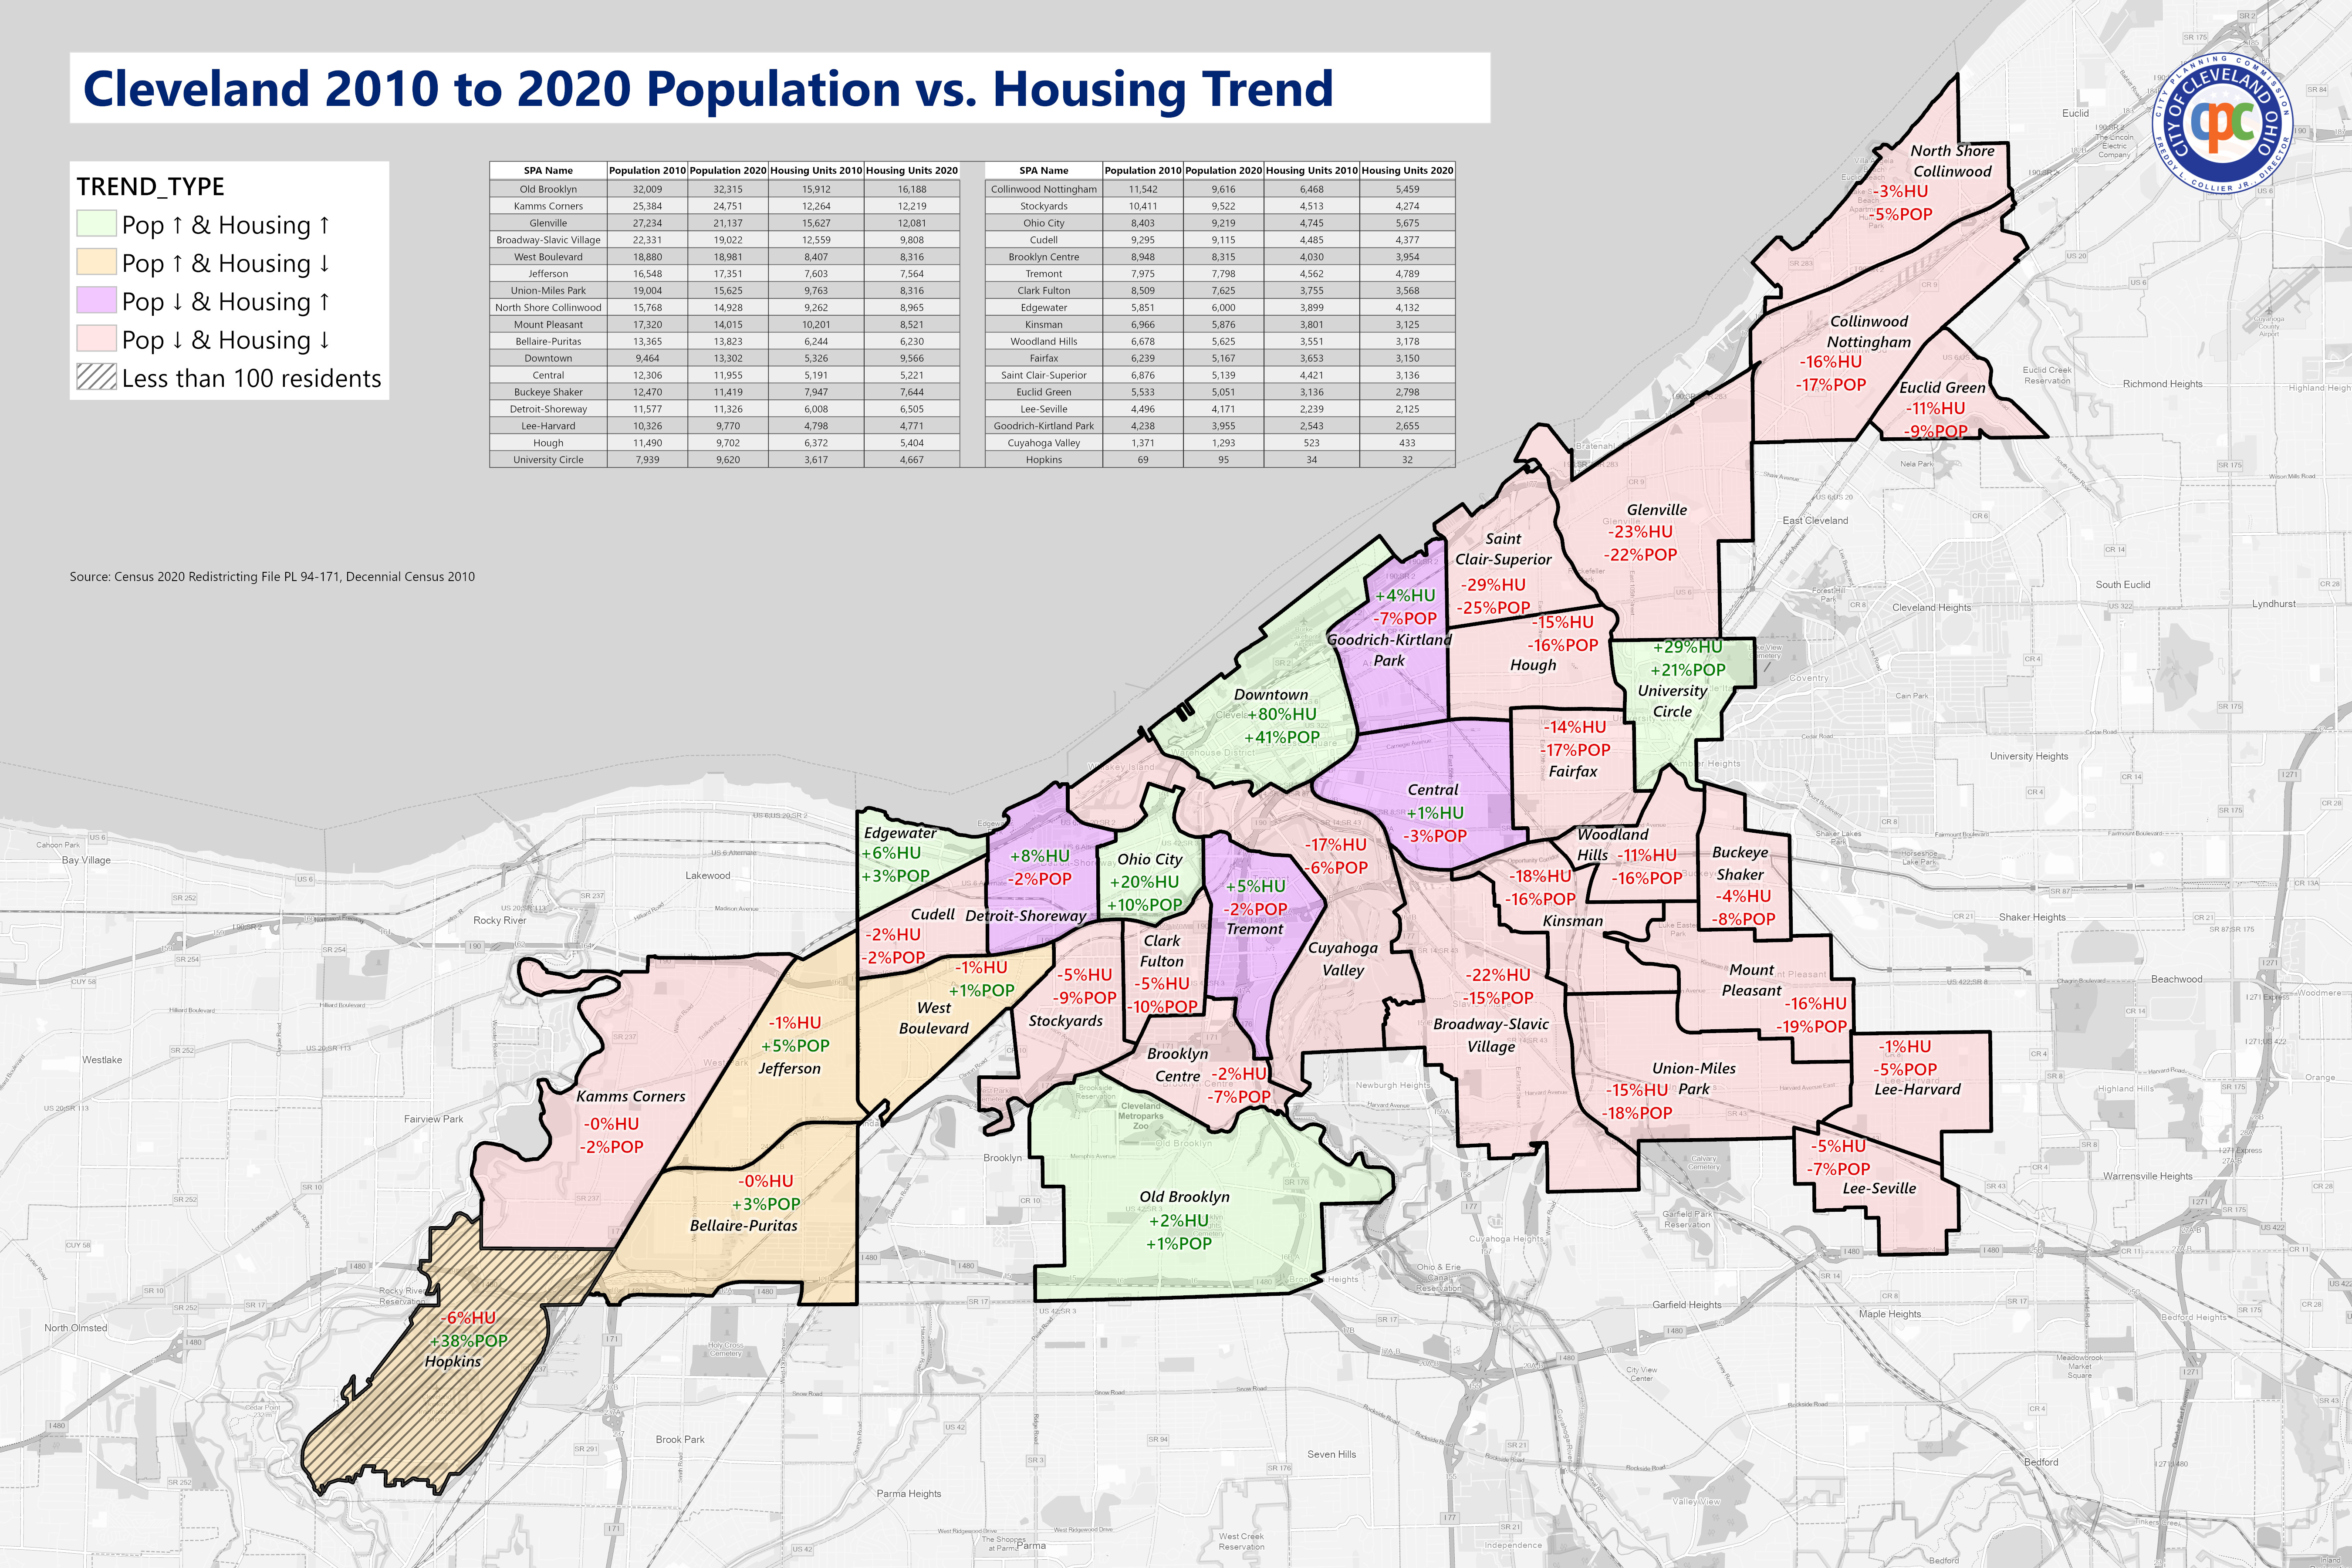
The following maps and tables show population and housing change by Statistical Planning Area (SPA), a legacy technical term for neighborhoods.
The two neighborhoods that saw substantial increases in population were Downtown and University Circle, which combined saw an increase of +5,519 residents. Moderate increase also occurred only on the west side, in Ohio City (+816), farther west in Jefferson and West Blvd, and Bellaire-Puritas (together +1,362), and finally Old Brooklyn (+306).
Overall, the east side saw decreases in population and in housing units, with Glenville counting a loss of -6,097 people and -3,546 housing units . It is worth noting that these east-side neighborhoods had some of the lowest self-response rates in the nation, are historically undercounted (especially children), and classified by the Census as "hard to count" areas due to digital access, government mistrust, and a variety of issues rooted in systemic racism.
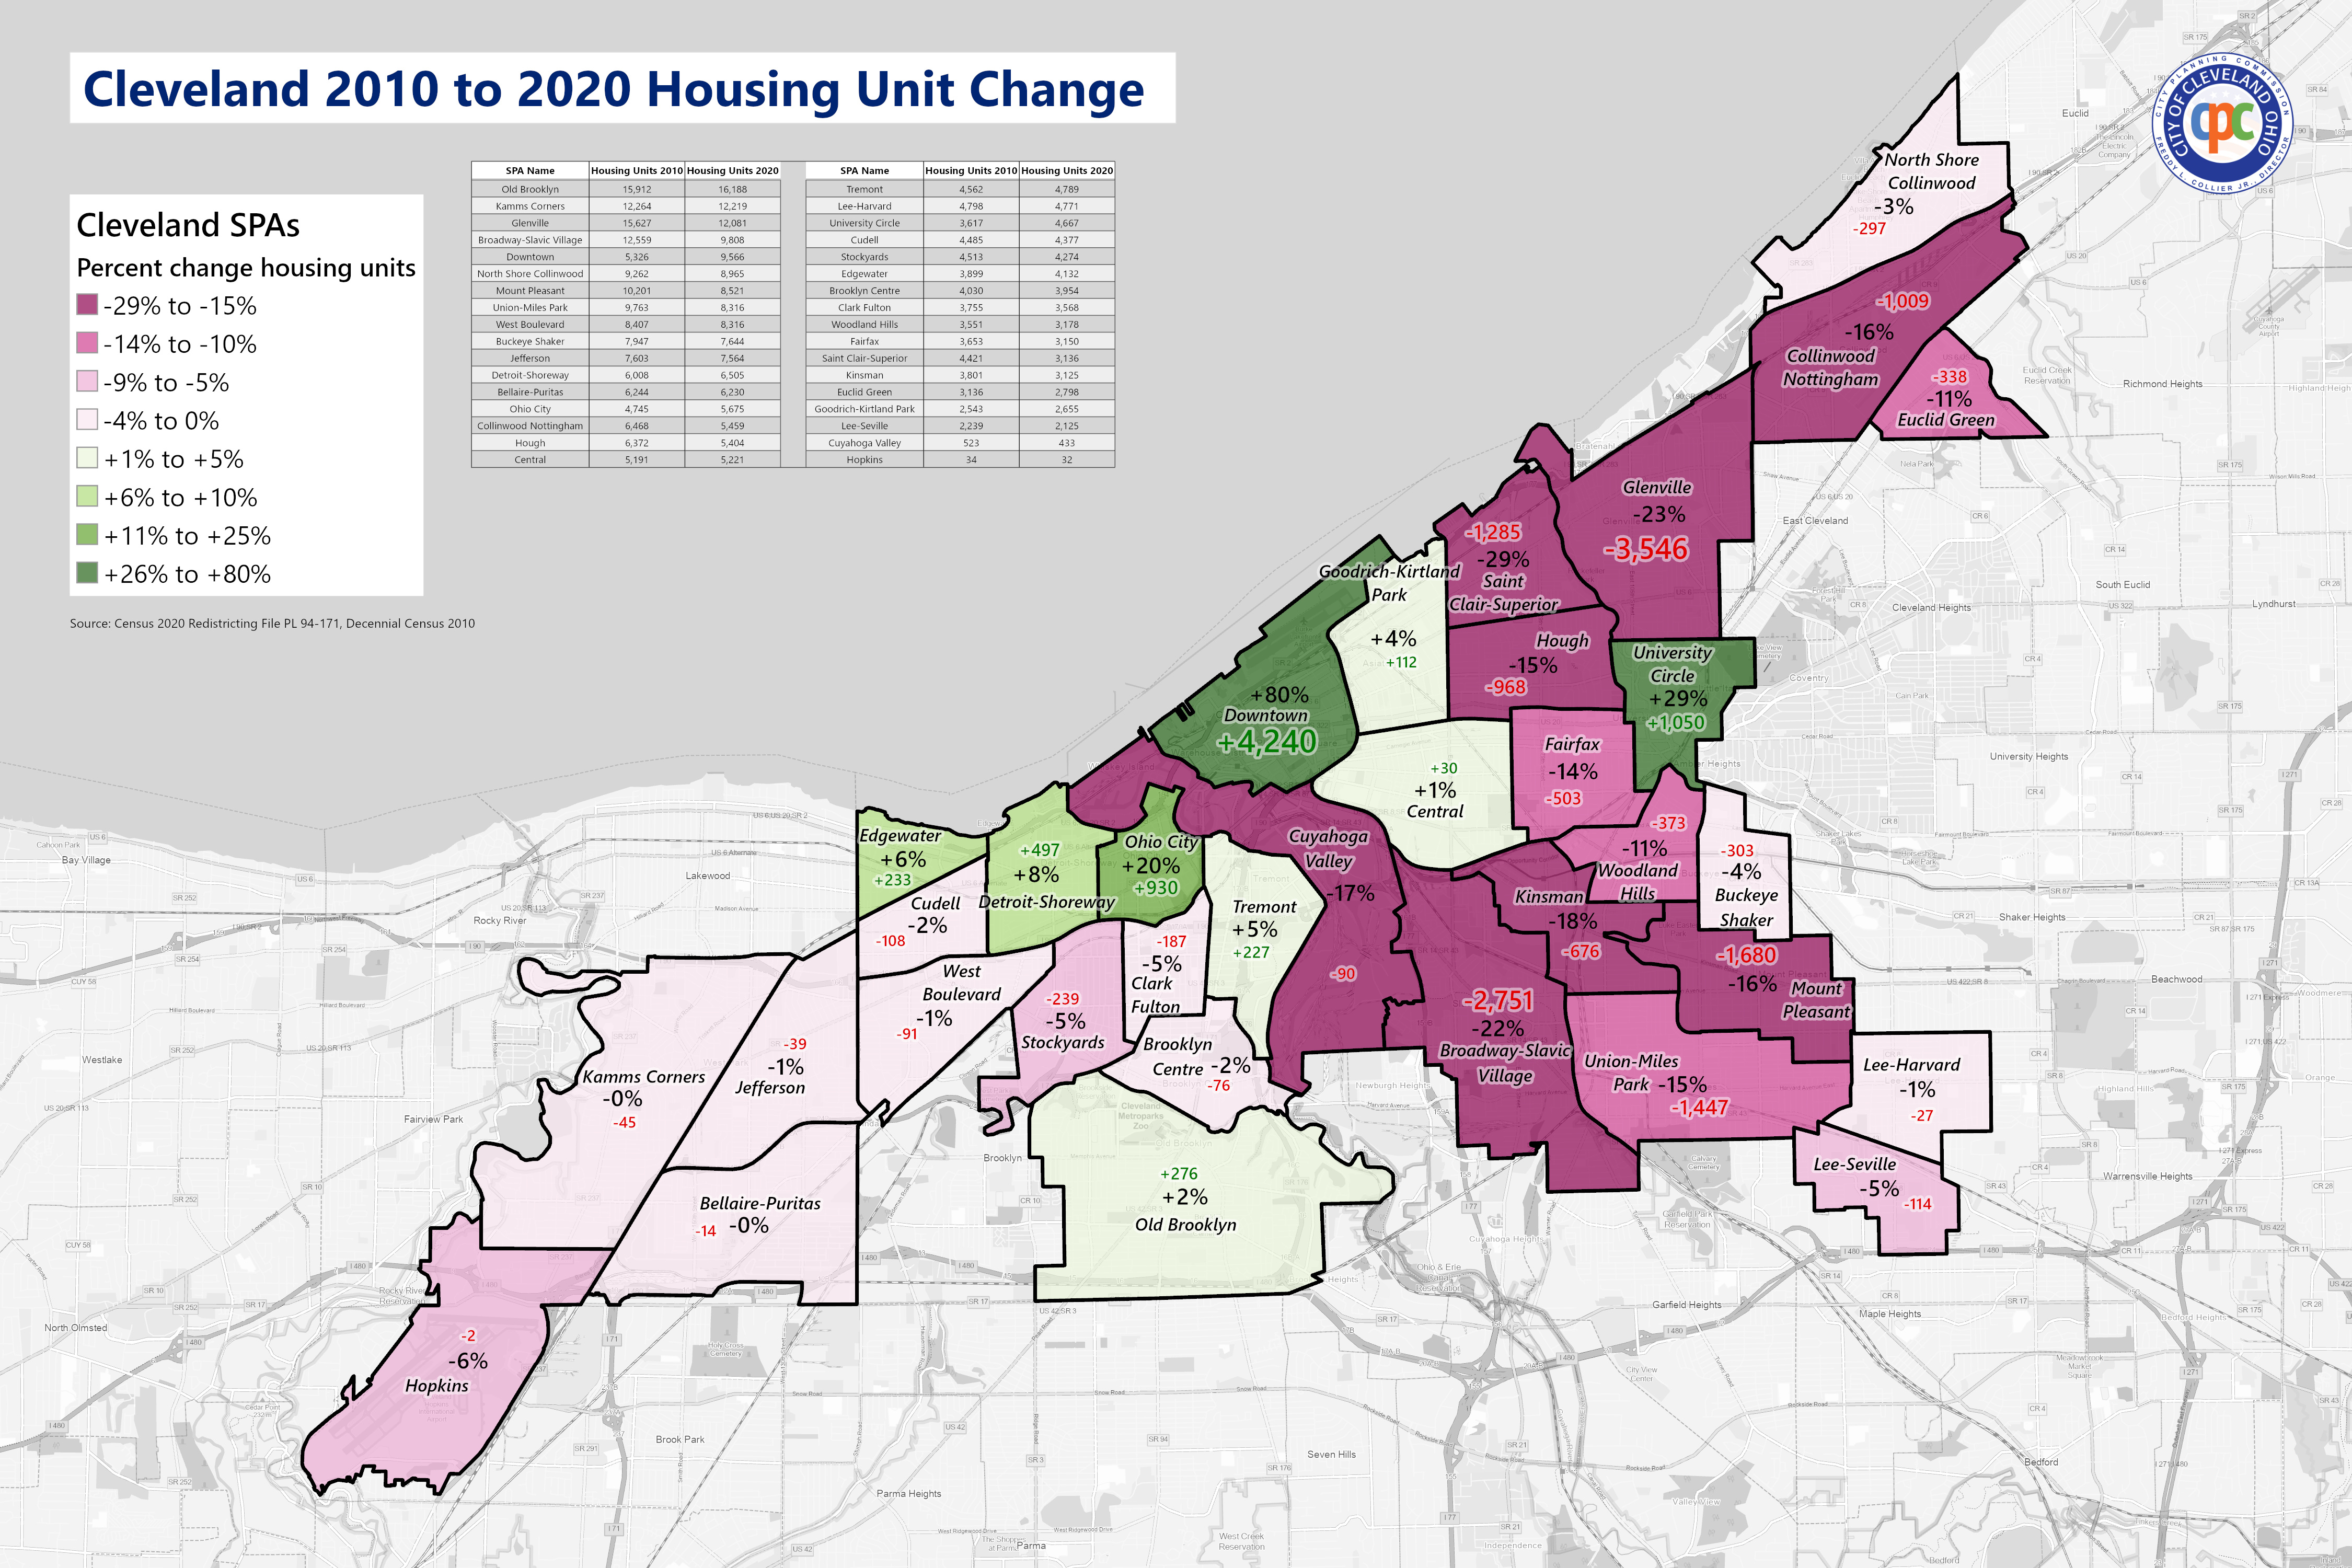
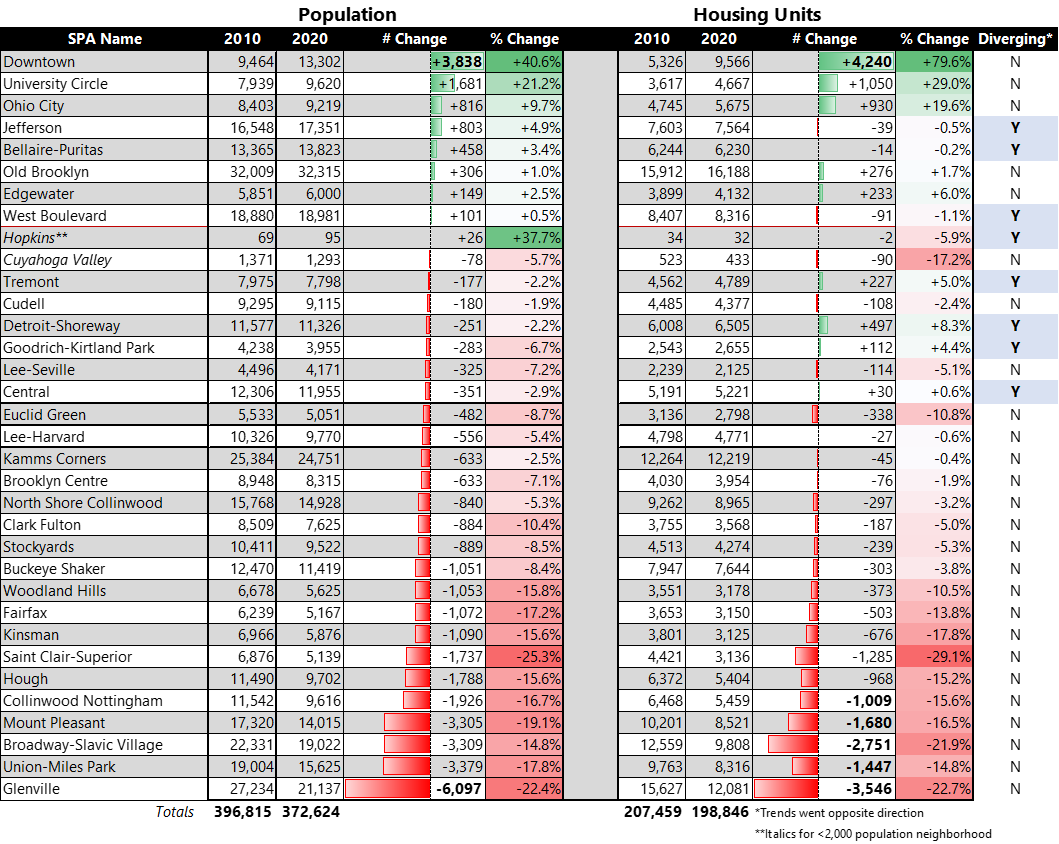
There were several SPAs that saw diverging housing and population trends. This means population increased while housing decreased, or vice versa.
Diverging trends can be understood by looking at tract-level changes within neighborhoods. In some neighborhoods, there was significant disinvestment and depopulation occurring in one part of the neighborhood, while new housing and residents came to another part. Another major contributor of diverging trends is the continued decrease in household sizes. Cleveland's average persons per household declined (like much of the country) from 1.91 people per dwelling to 1.87 from 2010 to 2020. In some neighborhoods, this decline in people per household was significantly more pronounced, and can help why housing change and population change are not perfectly correlated. For example, Downtown went from 1.77 to 1.39 per household, Detroit-Shoreway from 1.92 to 1.74, and Ohio City from 1.77 to 1.62. One of the few neighborhoods where people per household noticeably increased was Broadway-Slavic Village, from 1.78 to 1.94.
Cleveland City Planning will be diving deeper into the Census 2020 results in the coming months. We will also be sharing analysis of tract-level changes, broken down by race, age, sex, and housing types.