|
A hard look at the numbers and trends that define Cleveland’s current situation with respect to the birth rate, educational attendance and attainment will give a clearer picture of the challenge before us, and may also suggest some areas of greatest vulnerability (or opportunity), where connections with appropriate community assets could be helpful:
-
Families with Children: In 2000, when the federal census took its once-a-decade “snap shot” of Cleveland’s demographics, 60% of Cleveland families had children under age 18 living at home. Worth noting is the fact that this percentage appeared to be growing at an even faster rate in the city than in Cuyahoga County as a whole. The implications of this trend are sobering, suggesting as they do that in future years (1) more public resources for primary and secondary education may be required, (2) area colleges and technical schools may need to increase their capacity, (3) more jobs may need to be created by the regional economy, and (4) the need for social services also may increase.
-
Teen Births: In one four-year period, from 1996 to 2000, the average number of births to underage or teen mothers (age 10 to 17) recorded in Cleveland was 24.4 for every 1,000 females in that age cohort—a rate double the county average. It is a documented fact that young women and girls who give birth during their school-age years frequently suffer, as a result, significant economic and social hardships—which tend to drastically limit their educational attainment and employability when these mothers reach adulthood, perpetuating the cycle of multi-generational poverty.
-
School Enrollment: At the same time, the census revealed, a smaller percentage of Cleveland’s three-to-17-year-olds were enrolled in school (90.2%) than their counterparts county-wide (92.0%). The percentage of children enrolled in school is a key figure because it will impact the overall education level of the city’s future workforce (and parents and voters). A low enrollment rate now means that fewer children are receiving even a basic education, which will severely limit their employability as adults (as well as their functioning in other important capacities vital to the community’s future).
-
Enrollment, Employment and Unemployment of 16-19 Year Olds: Though it is lower than the county average, the percentage of 16-19 year olds living in the city that were either employed or enrolled in school climbed from 81.2% in 1990 to about 83.0% by the turn of the century. However, that means that 17% of the city’s 16-19 year olds—an alarming 4,363 persons--were neither in school nor gainfully employed. This indicator is disturbing in another way as well, as it also measures the ability of our educational system to retain and train students, and of our business sector to provide employment for our graduates. Although improvements are being made in both places, 4,363 is still far too large a number for a community serious about being competitive—much less a good place to live—to accept.
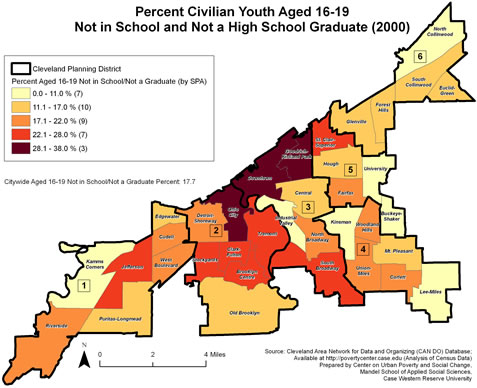
Figure 2 shows the geographic distribution by neighborhood (by percentage of each neighborhood’s population falling into that age group) of 16-19 year olds who are neither currently enrolled in school nor are high school graduates. Seven of the neighborhoods within the city that had significant percentages of youths 16-19 who were neither enrolled in school nor high school graduates, on the other hand, are home to some of the largest youth populations in the city. Though the percentage of young people falling into this category in neighborhoods such as Central and Kinsman may be smaller, so are the hard numbers, due to the fact that these areas have lost much of their population; while in others, such as like Ohio City, Tremont and Jefferson, the larger percentage of youths not enrolled in school or holding diplomas is in some ways offset by the fact that these SPAs also claim a fair percentage of the city’s educated population.
-
Educational Attainment, Ages 25-34 BA: Nationwide, the number of 25-to-34 year olds declined by 8.0% nationwide during the 1990s, primarily due to the aging of the baby boomer generation. In Cleveland, however, this particular cohort shrunk by twice that. At the same time, the share of adults holding college degrees grew only very slowly here, which, taken together with the shrinking size of the 25-34 cohort, contributed to a low level of residents with degrees. According to the 2000 census, Cleveland ranked 96 th on the list of the 100 largest U.S. cities in college degree attainment, with only 11% of its population holding bachelor’s or professional degrees. In contrast to the trend that prevails in other cities, however, Cleveland’s low educational attainment rates are not just confined to one specific group. All of Cleveland’s minority populations—blacks, economically disadvantaged whites, and Hispanics—appear to suffer from lower than average educational attainment. And “suffer” is the right word here.
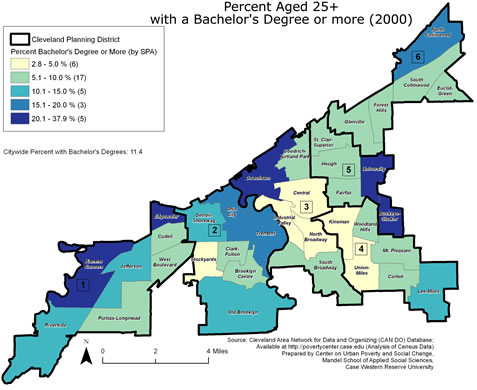
Figure 3 shows the distribution by neighborhood of Cleveland residents holding college or professional degrees. Although the overall percentage is low at 11.4%, it’s hard not to notice that, with the exception of Tremont and Ohio City, the neighborhoods with the highest percentages—Downtown, Edgewater, Kamm’s Corners, University, North Collinwood and Buckeye-Shaker—all have something in common: They are alledge neighborhoods, communities that border either suburban areas or the waterfront. These neighborhoods also tend to have higher real estate values and amenities unmatched by other SPAs within the central city, thus tending to attract a larger share of highly educated residents. Arguably, Tremont and Ohio City, which also attract this segment of the population, lie along another waterfront, the Cuyahoga River Valley, with its dramatic vistas and views of downtown, which makes the high-lying neighborhoods of the near west side feel like cosmopolitan counterparts to the business center on the opposite bank.
This pattern has led, historically, to a kind of “hopscotch” effect: As central city residents become more affluent, they tend to move in stages from the central core toward the city’s edge, with every economic plateau they reach carrying them further out –and in the process confirming the axiom “more money, more space, more amenities.” Clevelanders, in other words, continue to associate success with suburban living. Another lesson here might be that new residential developments within the city that give more attention to things like “more space” and “more amenities” might begin to reverse that thinking, and that trend.
-
High School Graduation Rates: In 1998, the graduation rates for students in the Cleveland Municipal School District were the lowest among the region’s 103 public school districts. However, this figure has been steadily rising, from 33 percent in 1999 to 36 percent in 2001. Students who are unable to graduate from high school will find themselves at a severe disadvantage in the job market, not to mention ineligible for college or professional degree programs. But it must not be forgotten that high school graduation rates also impact the overall preparedness of Cleveland’s future work force, and thus interest or lack of interest on the part of companies considering whether to locate, or remain, here. In short, high school graduation rates affect everybody’s—the entire community’s—future prospects, and the economic development of the region. Many of the assets on which we hope to build, along with certain taken-for-granted amenities that impact the quality of life in Cleveland, could be in jeopardy, while the need for social services will increase. Each percentage point by which the graduation rate is increased is another building block of the city’s future competitiveness put in place.
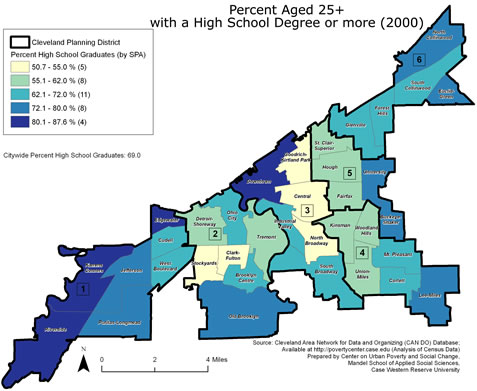
Figure 4 illustrates the percent of individuals age 25 and over with at least a high school diploma. Downtown, Edgewater, Kamm’s Corners and Riverside have the largest percentages of high school graduates.
- Mothers in the Labor Force with Children Under Age Six: others in the Labor Force with Children Under Age Six: Cleveland had a smaller proportion of mothers in the labor force with children under age six (61.9%) than the county as a whole in 2000. However, comparison with the previous census figures reveals that Cleveland’s rate rose more steeply than the county as a whole since 1990, when only 48.1% of city mothers with children under six were working outside the home. This jump of nearly 14 percentage points in Cleveland was almost half again as high as the increase experienced by the suburbs during the same period. The highest figure was in the Lee-Miles SPA, where almost 81% were employed; the lowest, in the near west side’s Ohio City neighborhood, with 48.2%.
Source: Social Indicators 2003, Case Center for Poverty & Social Change
The Federation for Community Solutions provides information to help social service agencies make decisions. In 2003 it issued a social indicators report on childcare which can be accessed here. The report shows the availability of child day care by neighborhood. Neighborhoods such as Lee Harvard which have a high percentage of single working mothers require a great deal of day care options. For other reasons communities such as Central also have high childcare facility needs due to higher percentages of young mothers who are not in the workforce and are of school aged (teen mothers). The city must focus its attention and resources on working with faith-based intuitions to promote programs for teens and adults that teaches and reinforces family values and healthy relationships. The only way to deal with the systemic social problems that often force government to spend monetary and human resources to deal with them is a proactive strategy that includes dealing with the behaviors that lead to social decline. The faith-based community is a critical link to countering the negative social trends that lead to broken families and unwed mothers. The problem has been the lack of acknowledgment of the root problems that contribute to the social and moral decay of our communities.
Back to Top Next Page:Education and Community Service:Assets |