|
Several trends emerge that give a clearer picture of the challenge before us, and may also suggest some areas of greatest vulnerability (or opportunity), where connections with appropriate community assets could be helpful. (Click on highlighted links to access maps and charts with more detailed information.)
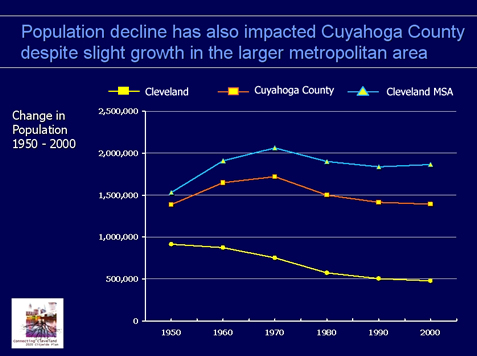
- Population: Cleveland’s population has been declining since the 1950s. Thirty-two other U.S. cities are now larger than Cleveland, once the fifth largest city in America, though the pace of loss slowed considerably in the 1990s. Cleveland’s Downtown, however, has performed well compared to downtowns in other cities.
In 2000 the United States Census Bureau listed the city’s population at 478,403. Cleveland’s population loss during the 1990s was 5.4% compared to a loss of 8.9% during the 1980s. The number of households has also declined, albeit at a slower pace than population, and stood at 190,638 in 2000. (See Graph.) Out-migration of residents is the principal reason for Cleveland’s population loss.
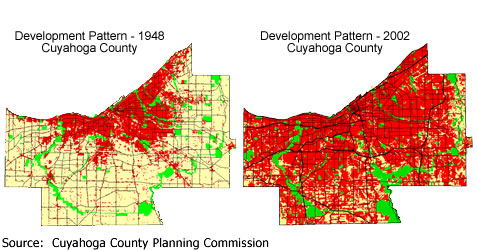
Cuyahoga County has also started to see a decline in population. Despite a development pattern in which developed property (red areas on the maps below) covered over twice the land area in 2000 than it did in 1950, the county’s actual population in those two years was nearly identical. While there were 40% more households in Cuyahoga County by the end of that 50-year period (Household Trend), the average number of household members had fallen from 3.1 to 2.39 for the county, and in the city of Cleveland, from 3.1 to 2.44.
While the core of the metropolitan area continued to decline in population, the outer suburbs continued to expand. The four-county metropolitan statistical area that includes the city showed an increase of 1.4% or 25,000 people between 1990 and 2000. The pattern of population growth shows much of the city and inner suburbs declining in population with the growth occurring at the periphery of Cuyahoga County and in surrounding counties. Some census tracts in and around Downtown Cleveland, which had previously experienced severe population declines, have shown population increases as a result of new housing construction.
Because major employment centers such as Downtown, University Circle and industrial districts are located within the city of Cleveland, the number of people that actually work in the city—and thus require many services on a daily basis—is larger than its residential population. The Census Bureau estimates that the city’s daytime population increases to approximately 593,000 due to the influx of commuters to their jobs.
- Ethnicity and Race: Cleveland’s growth during the late 19 th and early 20 th centuries was fueled by immigrants who flocked to the city seeking jobs generated by the industrial revolution. Around the middle of the 20 th century the number of immigrants entering the city, as was also the case with other cities across the country, decreased. But where many cities experienced a rise in immigration during the later 20 th century, especially in terms of Hispanic and Asian immigrants, Cleveland did not see a dramatic increase in numbers. (Immigration Trend). In fact in 2000 Cleveland had the lowest foreign-born population among the targeted cities studied by the Brookings Institution. Even within the Cleveland area, many suburban communities can boast a higher foreign-born population than the city of Cleveland. Many new immigrants, when they enter the country, bypass the central city and move directly to the suburbs. In Cleveland most of the foreign-born are of European or Asian decent.
Over the years an increasing percentage of the city’s population has been non-white. In 1990 just over half of Cleveland’s residents were non-whites. During the 1990s that number grew to 61.2 percent with the proportion of African-Americans and Hispanics increasing the most.
The segregation of African Americans from whites and of African-Americans from Hispanics exceeds the averages for many large cities. Cleveland’s African-American population is concentrated on the east side of the city and in the near eastern suburbs. Hispanics are concentrated in the city’s west side neighborhoods.
The city’s African-American population increased by 10,837 persons, from 235,405 in 1990 to 246,242 in 2000. This increase occurred primarily because births exceeded deaths by more than 26,000. There was a net out-migration of 15,329 African Americans during the decade, which partially offset the increase in population. Births among whites also exceeded the number of deaths by more than 9,300, but that coupled with a net out-migration of approximately 53,093 resulted in a decrease of 43,747 in the white population. At the neighborhood level, increases and decreases in net migration by race varied widely between 1990 and 2000. Some areas, like the Broadway and Collinwood neighborhoods, have seen a significant change in their racial makeup since 1990.
- Age Demographics: Cities in general tend to be younger places than the suburbs. The median age of Clevelanders in 2000 was 33 as compared to the median for Cuyahoga County of 37.3. Young children age 5 to 9 make up the city’s largest age group. Baby boomers and young adults also comprise a large segment of the population. These age cohorts were also the only ones in which Cleveland saw an increase in population between 1990 and 2000. The composition of the city of Cleveland’s population by age is illustrated in the following population bell.
Cleveland - Population by Age Cohort, 2000
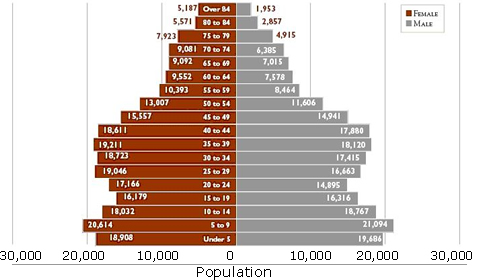
Source: The Brookings Institution
High concentrations of persons under the age of 18 are found on the southeast, northeast and near west sides of the city. Individuals over the age of 65 are concentrated in the city’s inner suburbs and parts of the east side. Some 70 children and seniors are being supported by every 100 of Cleveland’s working-age adults—the second highest percentage of economically dependent population found among the 23 target cities looked at in the Brookings Institute study.
- Household Type: Compared to other cities, Cleveland has a relatively small married-couple family population and a large single-parent family population. The city also has a high percentage of single-person households. During the 1990s the city of Cleveland saw a drop in married-couple households while it showed a slight increase in other household types. During that same period the suburbs saw rapid growth in single-parent and single-person households. The suburbs showed a slight growth in married-couples without children but also lost population in married-couple-with-children households.
- Turnover: Cleveland has more long-term residents than many other cities. In 2000 only 16.1% of the city’s population had lived in a different city five years before (1995). Among the 23 cities targeted by the Brookings Institution study, Cleveland had the sixth lowest share of “new arrivals”.
-
Education: The nation’s long-term transition to a service-oriented “knowledge” economy means that places with a critical mass of educated workers have a competitive advantage. In 2000 in Cleveland, almost 1 in 4 children lived in a family with no working parents. The percentage of Cleveland adults holding a bachelor’s degree is the fifth lowest among the nation’s 100 largest cities. The percentage is rising but is still below the average for the 23 cities compared in the Brookings study.
The city of Cleveland also has the second smallest university student population among the 23 cities studied.
- Income: Cleveland’s median household income in 2000 was $25,928, up 8.3% from its 1990 median income of $23,945. This was twice the national average increase of 4.0% but still left Cleveland ranked third lowest among the 100 largest cities in the country. It was also just two-thirds of Cuyahoga County’s median household income of $39,168. The national median income in 2000 was $41,994. Low-income households outnumber high-income households in the city by 5 to 1.
- Poverty: The poverty rate in Cleveland declined somewhat during the 1990s, going from 28.7% in 1990 to 26.3% in 2000. However, the child poverty rate (38%), was found to exceed the city average in 2000, while the elderly poverty rate (16.8%) came in below the city average. The greatest concentration of poverty is found on the city’s east and near west sides, where many of the city’s Hispanic and African-American residents live. Not surprisingly, Cleveland had the second highest Hispanic and African-American poverty rates of the 23 target cities in the Brookings Study.
Back to Top Next Page:Population:Challenges |